Last year I came across an article in the local Currie and Balerno newsletter looking for volunteers for the local hydro scheme located at Harlaw reservoir. My first thought was, ‘Hold on – there’s a hydro scheme up there?’
After a quick search I came across the Harlaw Hydro website and read the various AGM notes and presentation slides. What blew me away though was the revenue generated and how this was used to fund local resources and activities. It was clear this was a significant contributor to the local community and few people were aware of it.
After a few emails I was put in touch with Andrew Clark, the main technical contact for Harlaw Hydro and I went for a brief visit to the turbine house at Harlaw reservoir to be shown around. As as a software engineer I very rarely get the chance to interact with engineering systems like this and it was very refreshing to hear and see the power of the water via the turbine and generator setup.
Andrew explained that data has been collected from the hydro system for over 10 years and a project that he’d been trying to get off the ground for a while was a forecasting system whereby the power on the turbine could be ramped up in anticipation of high volumes of water. So I got to work on this project with another volunteer, admittedly at a fairly slow rate of progress.
The first thing we looked at was how the data is being stored and presented. The basic setup is a raspberry pi ‘edge’ computer which scrapes data from the control system and then pushes this to an external database. The data is then used primarily for the Harlaw Hydro’s website for displaying power profiles and user downloads via CSV files.
We first applied various data processing scripts, mainly through Python notebooks to understand more about the data, and we found it very interesting to see the various flood events through the 10 year history. This setup was fine for reasonably technical people, but we thought we could do better and then looked into how to create a real-time dashboard. Cue Grafana.
I had come across Grafana in my work where it was used for performing real-time monitoring of a power transformer but I had never got my hands dirty with it. So I set about creating a basic dashboard for the Hydro scheme and came across my first major hurdle – access to the external database. This is hosted by a company in England and after enquiring about allowing Grafana to create connections to this database, this was a no-go.
The solution was to create a database on a cloud provider, which in our case was Google Cloud – the sole reason for this choice being my experience with the technology. Admittedly we would be maintaining two databases, but it was felt this was a reasonable compromise, and I’m fairly sure that at some point in the future the other database will be deprecated.
So after various deployment configurations, we set up the database and then populated it with real hydro data. In addition, we created a REST API for allowing data to be pushed to the database from external sources (such as the raspberry pi) and other data scraping scripts that pull telemetry data from Thriepmuir reservoir (which fundamentally affects Harlaw reservoir) and SEPA rainfall data. The end result of this work was a database that stores a comprehensive set of data for Harlaw Hydro updated in quasi real-time.
We then started work on our Grafana dashboards, hooking up the various database fields to produce our first version of the – currently internal – dashboard for viewing Harlaw Hydro data. Here’s a view of some of the panels we currently display.
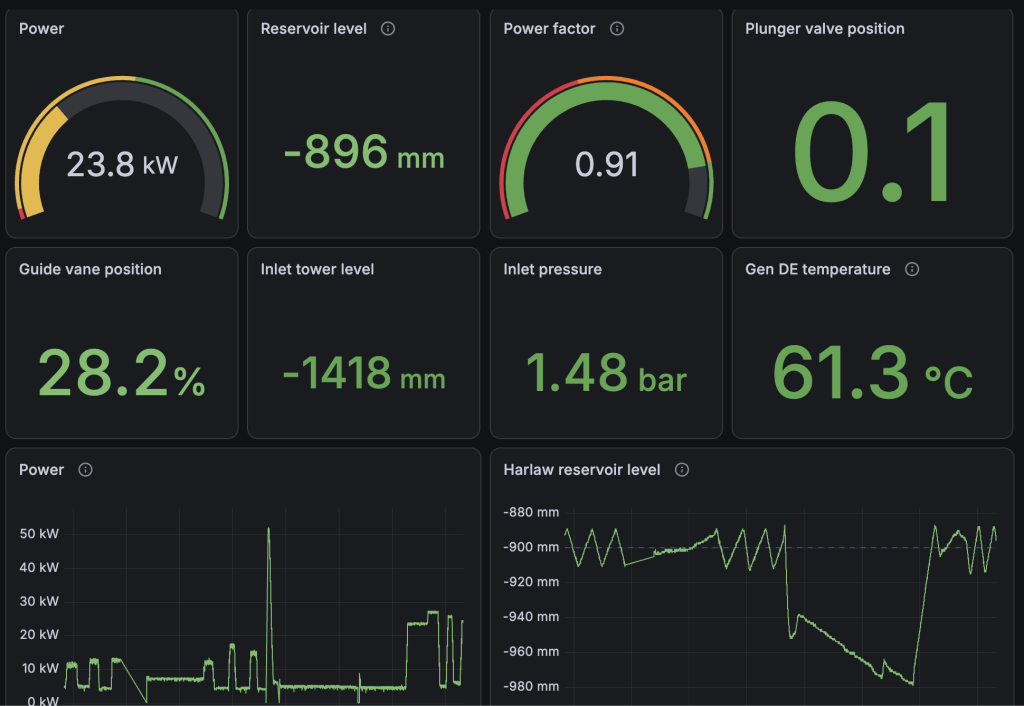
Using this we can visualise the current operating conditions of the hydro and, more significantly, we can easily select an historical time interval to analyse conditions during a flood event. For example, have a look at this view of Harlaw reservoir’s level over the last year. The winter flood conditions are obvious.
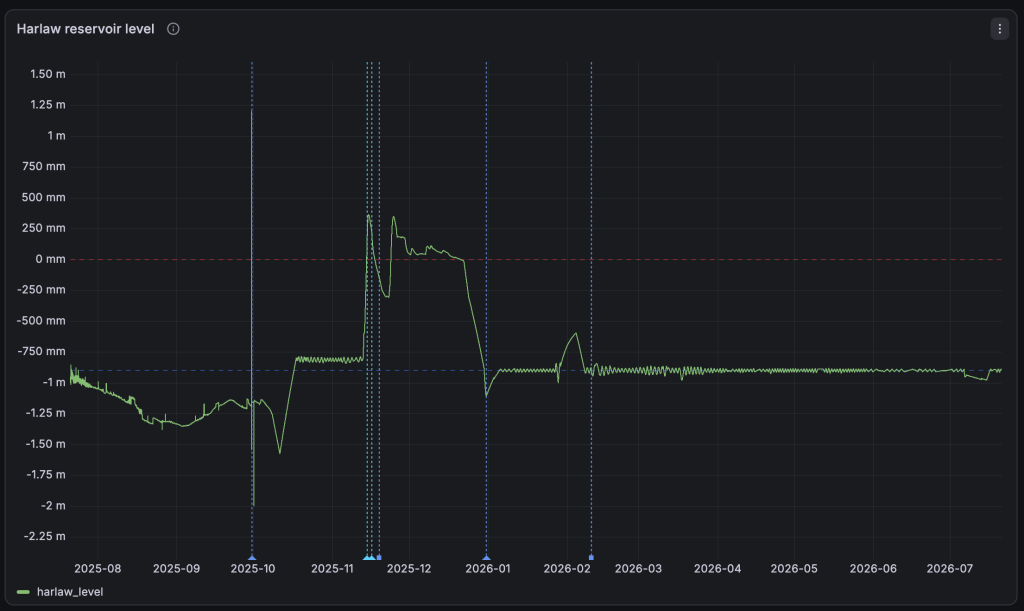
You can see blue dashed lines which are called annotations within Grafana dashboards and provide a really neat way of tagging point in time with events. For example, if the turbine is taken offline for maintenance.
So what’s next? Well, we’re still working on the flood forecasting system but we we have some software in place – we just need some flood conditions! We’re also aware that we need to find a new generation of local volunteers to take on the maintenance of the hydro, so if you think you’d be willing to lend some time then please do get in touch.
N.B. the image used as the thumbnail on the homepage is actually Threipmuir reservoir, not Harlaw reservoir. It was taken when the reservoir was very full and just about to ‘overtop’.